
Multi KPI custom visual can be used to display multiple KPI values in single visual. This visual is certified by Microsoft Power BI.
Let’s get started-
Download Sample dataset- Global_superstore_2016.xls
Follow these steps to create a Multi KPI:
Step-1: Import Orders dataset from Global superstore file.
Step-2: To import visual from app source you have to Logged-In first in Power BI desktop.
After load data into Power BI file, check the datatype for order date column, if datatype is not in date format then change it as in date.
After that click on ellipsis icon under Visualization Pane > then click on Get more visuals.
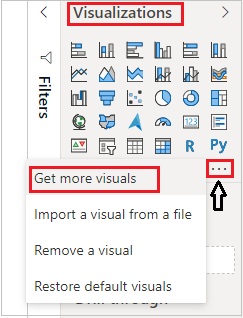
Get Power BI Visuals
Step-3: After that one dialogue appears. Now follow these steps-
Under AppSource Tab > Select Category “All” > Search for “Multi KPI” > Click on Add button.

Multi KPI – Import visual
Step-4: Now drag Order Date, Sales, Profit & Discount columns into visual.
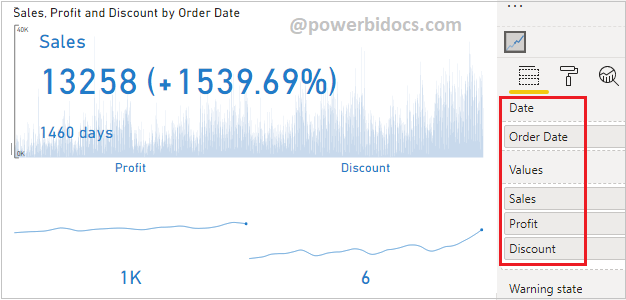
Multi KPI visuals power bi
Now understand KPI Percentage logic for Multi KPI visual
By default KPI will displays the values of max(or last) order date & percentage of min(or first) order date.
Here max order date is 31/12/2015 & min date is 01/01/2012.
First order date is 01/01/2012 and Sales is 808.56 & Last order sales is 13258

=(13258 - 808.56) * 100 / 808.56
= 1539.70%

Multi-KPI custom visual example
Formatting the Multi KPI visual
Select the visual and go to format bar section & set some important properties for multi KPI-
General: Allows you to set X & Y axis, width & height for visual.
Date: You can change the date format like:- d/M/yyyy, M/d/yyyy
Values: Set the formatting for each values individually.
Y-Axis: Allows you to set the font color, text size & display unit for Y axis.
Main Chart: Set the chart type, color & alternate color, when you hover the mouse on chart then you will see alternate color.

Multi KPI – Main chart property
Tooltip: Allows you to modify the details which you want to see as a tooltip, you can mange tooltip for each measures.
KPI: Set the font color & font family for main KPI display and also you can turned on/ off the KPI display.
KPI on hover: Change the appearance of the KPI when a cursor hovers over the KPI.
Sparkline Chart: Set the color for each Sparkline.

Multi KPI- Sparkline chart
Refer more Power BI visuals- Power BI Custom Visuals
Hope you enjoyed the post. Your valuable feedback, question, or comments about this post are always welcome.