Learn how to create a Dynamic measure selector in Power BI. This exercise includes adding a slicer to toggle between SalesAmount and Profit, enabling dynamic updates to the chart based on the selected measure for enhanced interactivity.
Tasks:
- Create a slicer that allows users to select either SalesAmount or Profit.
- Dynamically update the chart based on the selected measure.
Solution:
Load the below dataset into Power BI-
Sales Dataset
| Product | SalesAmount | Profit |
| Laptop | 50000 | 15000 |
| Smartphone | 30000 | 10000 |
| Printer | 15000 | 5000 |
| Headphones | 20000 | 6000 |
| Tablet | 25000 | 8000 |
Create a slicer that allows users to select either SalesAmount or Profit-
Step- 1: Add two measures: one for Sales and one for Profit. Right-click on the Sales dataset and select New Measure.
Total Sales = SUM(Sales[SalesAmount])
Total Profit = SUM(Sales[Profit])
Step-2: Create a Field Parameter Slicer by going to the Modeling tab, clicking on the New Parameter dropdown, and selecting Fields.

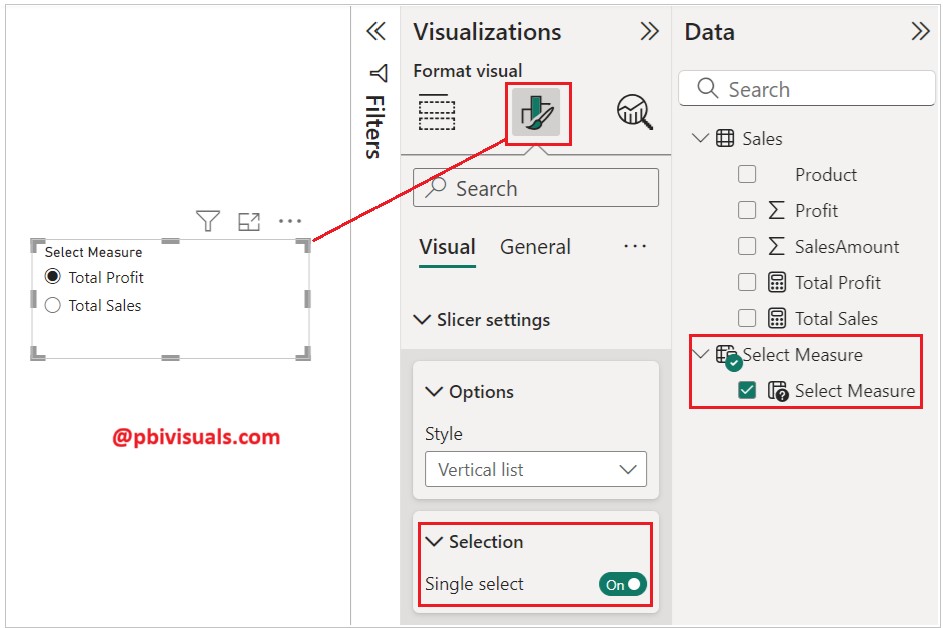
Step-3: Set the options below. Ensure that the Fields are selected, and provide the parameter name as Select Measure. After that, select both measures.
Make sure the Add slicer to this page checkbox is selected, and then click the Create button.

Step-4: Now select the slicer, go to the Format tab, open the Slicer settings, and turn on Single Select in the Selection section.
Dynamically update the chart based on the selected measure-
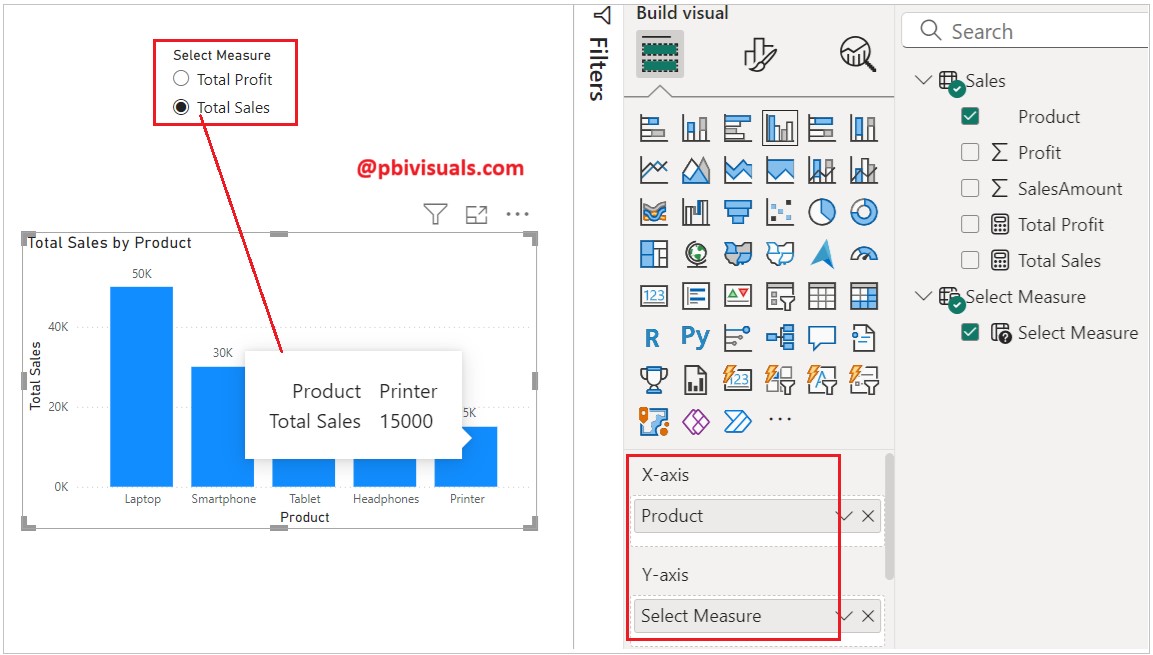
Add a clustered column chart to the report page. In the X-axis, add Product, and in the Y-axis, Select a measure.
After that, to check the result, choose a measure from the slicer.
I hope you enjoyed this Power BI exercise.
![]()