Home »
Power BI Visual
Microsoft Power BI support 30+ inbuilt visuals, using them you can make your report cool & attractive.
It help us to provide interactive visualizations, dashboard & BI Reports with self-service capabilities.

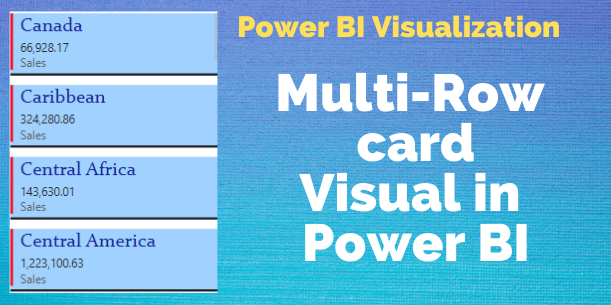
Power BI Multi-Row Card Visual
How to Create a Multi-Row Card Visual in Power BI? Multi-Row card visual Power BI.
![]()


Key Performance Indicator (KPI) visual in Power BI
Key Performance Indicator (KPI) Visual in Power BI? How to create a KPI % measure?
![]()

Creating a Table Heatmap in Power BI
How to create a heatmap without using custom visuals in Power BI? Table heatmap using Matrix visual.
![]()


Scatter Chart in Power BI
How to create a Scatter, bubble, and dot plot charts in Power BI? Storytelling with Power BI Scatter Chart.
![]()
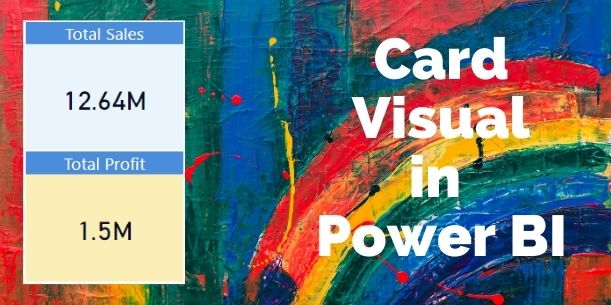
How to Create a Card Visual in Power BI?
Creating Power BI Card Visual, display single number in Power BI report page.
![]()

Creating a Small multiples charts in Power BI
How to create a small multiples chart with existing Power BI visuals?
![]()

Ribbon Chart in Power BI
How to create a Ribbon Chart in Power BI. Show ranking in Power BI using Ribbon Chart.
![]()


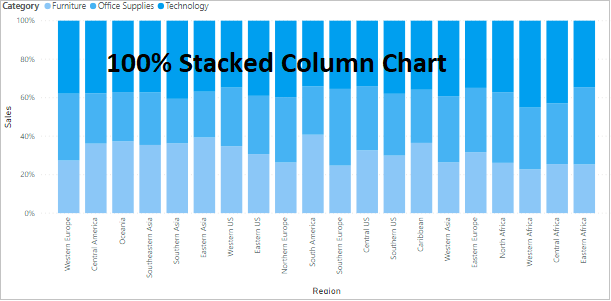

Stacked Bar Chart Visual
How to create a Stacked Bar Chart Visual in Power BI? Visualization in Power BI.
![]()