
In this blog you will understand “How to create a card visual in Power BI?”.
Refer – Card visual Drill through
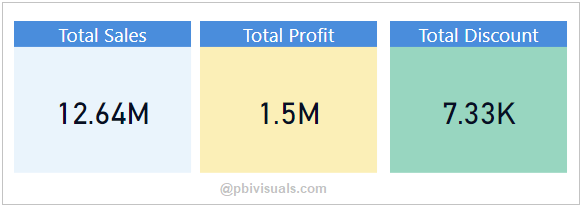
Power BI Card visual is used to display single values like Total sales, counts & single numbers in Power BI report page or dashboard.
In other words, It is useful to display summary counts data, like Total sales, Total profit, Total discount etc. You cannot display multiples numbers in single card visual.
Let’s get started-
Download Sample dataset- Global_superstore_2016.xls
Following these steps-
Step-1: Load Orders dataset from Global superstore file.
Step-2: Add card visual into Power BI report canvas and drag sales column over it.

Step-3: As you saw, it returns sum of sales. By default it returns SUM.
You can change the same, just do right click on ‘Sales’ fields and choose function according to your need like as – count, average, minimum & maximum etc.

Formatting the card visual-
General: Mange card height, width & X axis , Y-axis position
Data label: Change value font color, font size, display unit etc.
Category: Show & hide column name on Card, change font size, font family etc.
Title: Assign the title text, text size, font family, alignment & background color of card title.
Background color: you can change card visual background color.
Border: Set the border & border color for card visual.
Does the card visual support “Text” data type?
When you drag any string column in Card visual, by default it will display only first string name in that column(alphabetically). And when you right click to column name then it gives you some more option.
Now drag Region column into card visual-

As you can see above screen shot, by default it returns only first string name in Region column alphabetically, so “C” (Canada) comes first and “W” (Western Us) comes in last in alphabetical order.
Refer more Power BI visuals- Power BI Visuals
Hope you enjoyed the post. Your valuable feedback, question, or comments about this post are always welcome.
![]()