In this blog you will understand step by step – “How to create a Multi-Row card visual in Power BI”.
Power BI Multi-Row Card Visual is used to display summary data or you can say data in group format.
Refer similar post- Card visual
Let’s get started-
Download the sample Dataset from below link-
Following these steps to create a Multi-Row card visual-
Step-1: Import above dataset into Power BI Desktop.
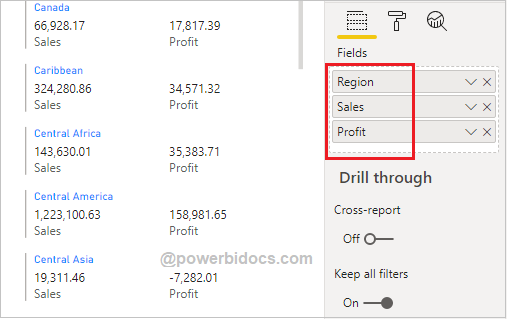
Step-2: Add one Multi-Row card visual into Power BI canvas with below columns.
Region, Sales & Profit
Step-3: As expected, it group by Region and returns the sum of Sales & Profit.
Step-4: You can also used measure with Multi row card.

Formatting Multi-Row Card Visual
You can change the font size, font family & background colors for Multi-Row card, following these steps:
Click any where on card and go to Format section and use below properties:
General: Mange card height, width & X axis , Y-axis position.
Data label: Change values font color, font size, display unit etc.
Category: Show & hide column name on Card, change font size, font family etc.
Card Title: Enable/ Disable Text on card like (Region name).
Card: This property provides some option-
- Outline: You can enable Top, Bottom, Left & Right outline for card.
- Outline color: You can change the color for outline.
- Outline weight: Increase/ decrease outline weight.
- Show bar: Enable/ Disable bar line before row.
- Bar color: Change bar color.
- Bar thickness: Increase/ decrease thickness for bar line.
- Padding: Mange padding between rows.
- Background: Change background color for card.
Title: You can give any Title to Card & change the font size, font family, alignment & background color of card.
Background color: you can change Card background color.
Border: Give border to card & change border color.

Refer more Power BI visuals- Power BI Visuals
Hope you enjoyed the post. Your valuable feedback, question, or comments about this post are always welcome.
![]()