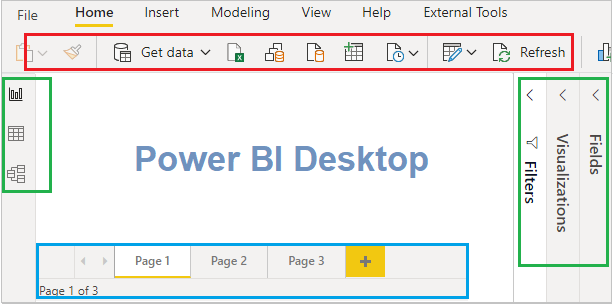
In Power BI Desktop when you begin to build any report you will be working in some main areas and they are- Ribbon, Views, Pages Tab, Visualization, Fields & Filters pane.
Let’s understand in details-
1- Ribbon: It displays common tasks like- Get data, Transform data, Add new visuals, Publish report etc. and that are associated with reports and visualizations.
2- Views: There are three types of views in Power BI-
- Report or Canvas view: Allows you to create & view the visualizations.
- Data view: You can see your all report data here, and you can quickly validate your data.
- Model view : Shows all of the tables, columns, and relationships in your model and you can set and mange the relationship between tables.
3- Pages tab: You can find this bottom of the page, allows you to add, select, remove the report page, also you can create a duplicate report page from here.
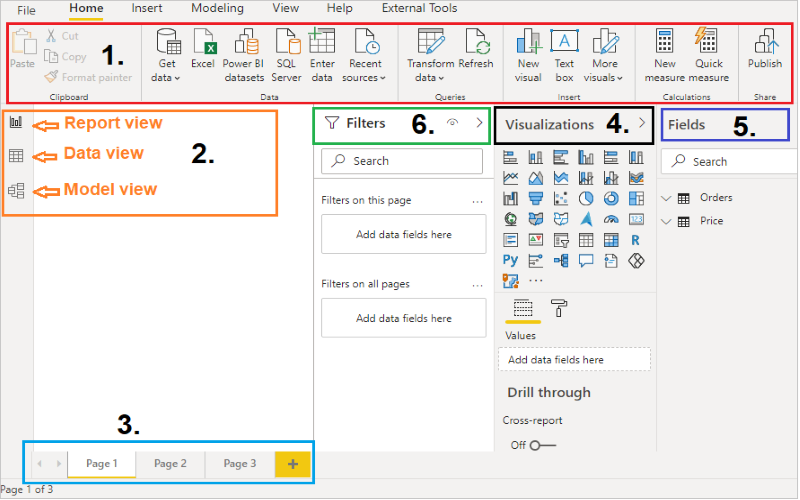
4- Visualizations pane: Provides you 30+ visuals, where you can change visualizations, customize colors or axes, apply filters, drag fields, and more.
5- Fields pane: It displays the tables, folders, and fields in your data that are available for you to use to create visualizations.
6- Filter pane: Filter pane types-
- Visual level filters: This is visual level filter and applied directly on individual visualizations. Such filters are applied both on data and calculation conditions used within a visualization.
- Page level filters: This filters are used to filter the visuals present in the page.
- Report level filters: The report-level filters are the filters that you use to apply a filter condition on the entire report.
Refer more Power BI Post – Power BI
Hope you enjoyed the post. Your valuable feedback, question, or comments about this post are always welcome.
![]()