
The Cumulative or Running total is used to watch the summation of numbers that is updated every time when a new number is entered to the sequence.
Let’s get started-
Download the sample Dataset from below link-
Following these steps-
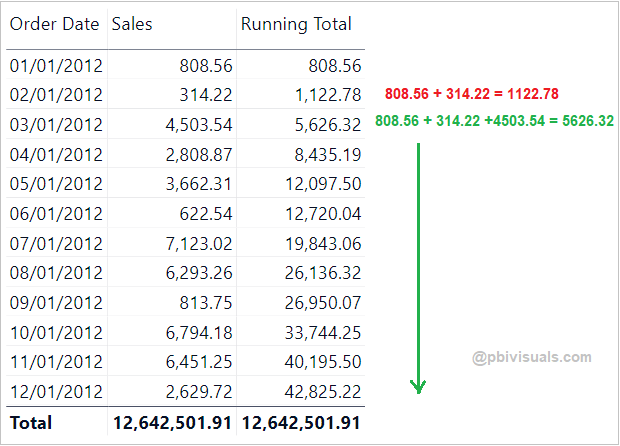
Step-1: Add one measure & write below DAX in order to create a running total-
Running Total =

CALCULATE (
SUM(Orders[Sales]),
FILTER (
ALL(Orders[Order Date]),
Orders[Order Date] <= MAX(Orders[Order Date] )
)
)
Measure Description:
- CALCULATE: Evaluates an expression in a modified filter context.
- SUM: The SUM function is a aggregation function and it calculates the sum of all numbers in a column.
- FILTER: Returns a table that represents a subset of another table or expression.
- ALL: Returns all the rows in a table, or all the values in a column.
- MAX: Returns the largest value in a column.
Step-2: Now drag measure into table visual to see the running total result.
You can also create a running total by using another DAX functions-
DATESYTD =

CALCULATE(SUM(Orders[Sales]),

DATESYTD(Orders[Order Date])
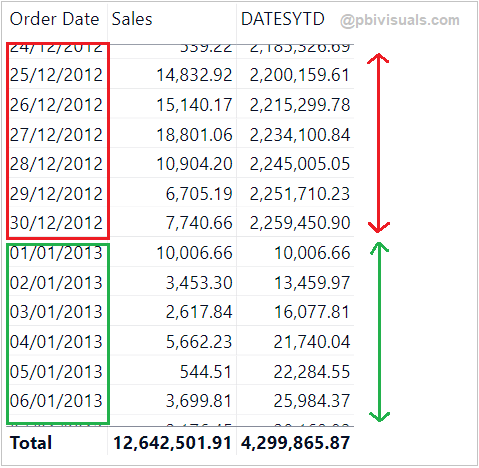
It returns the year wise running total and for every year it will start sales summation from the beginning. In same way you can use DATESMTD & DATESQTD DAX functions to get the running totals.
Refer more Power BI Post – Power BI
Hope you enjoyed the post. Your valuable feedback, question, or comments about this post are always welcome.
![]()