In this blog you will understand about Power Query, Power Pivot & Power View in Power BI Desktop.
What is Power Query?
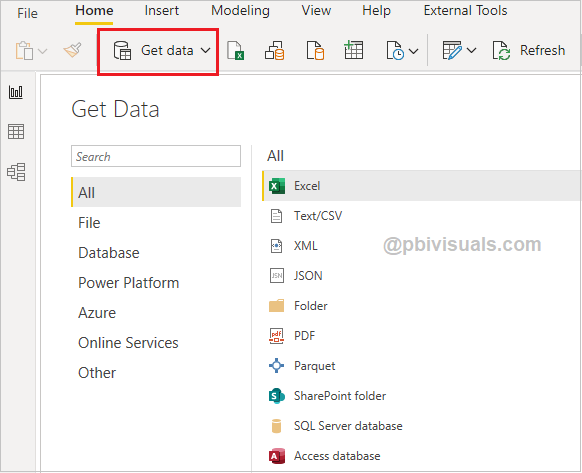
It is ETL component that helps us to extract, transform and load the data into Power BI desktop.
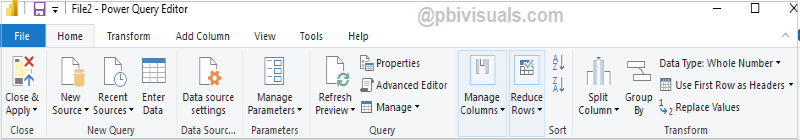
Power Query provides many transformation options in order to transform your data, some common transformations are-
- Group by
- Use First Row as Header
- Transpose
- Pivoting, Un-pivoting
- Reverse Rows, Count Rows
- Change Data Type
- Rename Column, Remove Column & Split column
- Apply Statistical Function, Math Functions & Trigonometry function
- Keep Top Rows/ Keep Bottom Rows
- Combine & Join Data(Merge Queries, Append Queries)
With Power Query you can extract data from multiple data sources like(databases, files, web pages, Azure etc.)
What is Power Pivot?
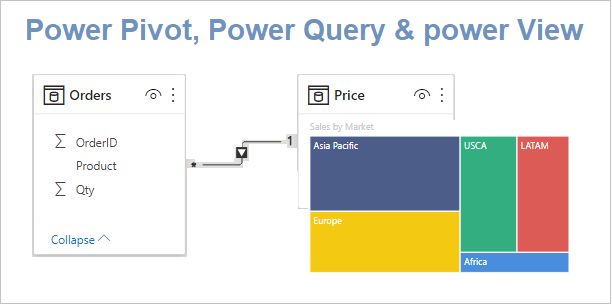
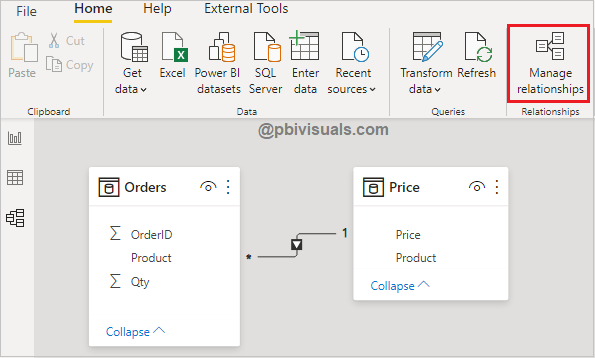
Power Pivot is the component where you can setup a relationship between Tables/Queries loaded into the data model.
It is calculation engine of Power BI. It is used to model complex business data, calculate data that needs to be displayed in the area of the value field in the Pivot charts/tables.
You can use the Data Analysis Expression (DAX) language to inform the Power Pivot about the various calculations you require.
What is Power View?
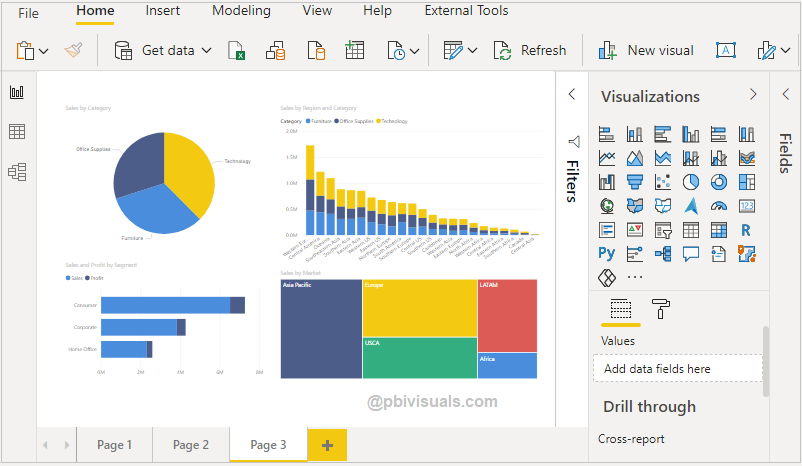
With the help of Power view, you can create interactive charts, graph, maps and other visuals.
Refer more Power BI Post – Power BI
Hope you enjoyed the post. Your valuable feedback, question, or comments about this post are always welcome.
![]()