
In this blog you will understand “How you can sort data by a column not shown in visual? Or Sorting data by a measure not shown in visual?”
Let’s start with chart visual-
Follow these steps-
Step-1: Add one clustered column chart into Power BI report canvas with some columns-
- Axis: Drag Region column
- Values: Drag Sales column
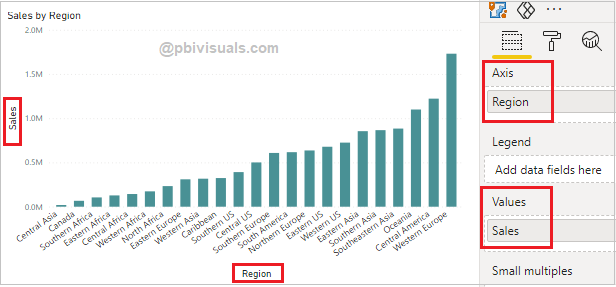
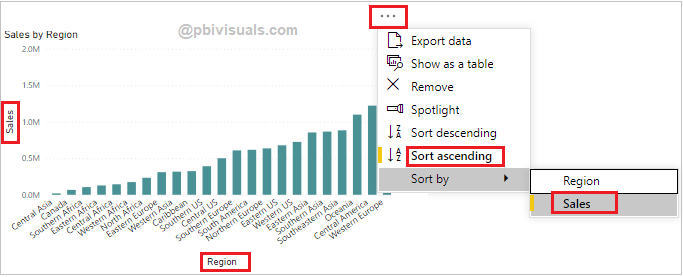
Step-2: You can see in the screenshot below, the data is sorting by sales column in ascending order.
Step-3: Suppose, you want to sort data by Profit instead of Sales column without adding Profit column in visual.
So you can achieve this by using this simple trick – Add that column in Tooltip.
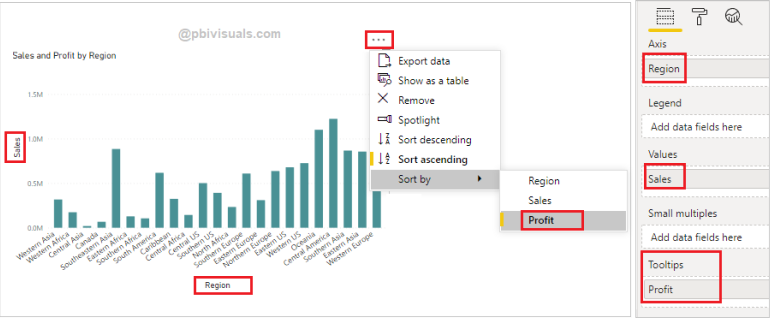
As you can see in above screenshot data sorted by Profit. In Tooltip section you can also drag the measure.
Sort data by column without shown in Table visual-
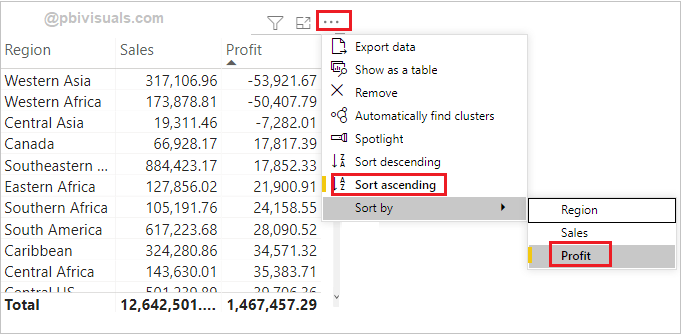
Table visual does not support the tooltip, so here we will hide the column after sort the data, follow these steps-
Step-1: Let’s take Table visual into Power BI report page and drag Region, Sales & Profit columns.
Step-2: Go to Format section and turned off Word wrap for “column headers” & “Values”.
Step-3: After that click on table ellipse icon(…) and sort data by Profit in ASC order.
Step-4: Now hide the Profit column by just dragging the column width right to left and make it very small.

Refer more Power BI Post – Power BI
Hope you enjoyed the post. Your valuable feedback, question, or comments about this post are always welcome.
![]()
Nice trick Sandeep, I usually do this by using related tables
Much better solution here: https://radacad.com/sort-by-column-in-power-bi