
In this blog I will show you how you can display orders shipment tracking status on Power BI visual like others e-commerce sites.
In Power BI we cannot create a exact as others but we can try the similar.
Result demo-
Let’s get stared-
Consider following two tables –
Table: Status
| Id | Status |
| 1 | Shipping soon |
| 2 | Shipped |
| 3 | Out for delivery |
| 4 | Delivered |
Table: Orders
| OrderNo | Status | DateTime |
| Order-1201 | Shipping soon | 1/2/2021 15:26 |
| Order-1201 | Shipped | 1/2/2021 16:10 |
| Order-1201 | Out for delivery | 2/2/2021 15:26 |
| Order-1201 | Delivered | 4/2/2021 16:10 |
| Order-1202 | Shipping soon | 1/2/2021 15:26 |
| Order-1202 | Shipped | 1/2/2021 16:10 |
| Order-1203 | Shipping soon | 1/2/2021 15:26 |
| Order-1203 | Shipped | 1/2/2021 16:10 |
| Order-1203 | Out for delivery | 2/2/2021 15:26 |
| Order-1204 | Shipping soon | 1/2/2021 15:26 |
Create a relationship between both tables based on Status column.

Now sort the Status column based on ID, because we want to display Shipped status in sequence way on visual, otherwise Power BI will sort the status alphabetically.

After that add one slicer visual into Power BI repot page with OrderNo column from Orders table. And go to format Pane > Click on Selection controls > Enable Single select.

Now add one line chart visual and add below columns-
Axis: Status column from Status table.
Value: OrderNo from Orders table.
And right click on Status column & select “Show items with no data“. After that go to format pane > Turned off Title only for X-axis and Disable Y-axis.
Formatting the chart visual-
X-axis: Set the font size and font family and turn off the Title for X-axis
Y-axis: Disable Y-axis.
Data color: Set color for line chart.
Shapes: allows you to set the line stoke width, line style, maker size & color.
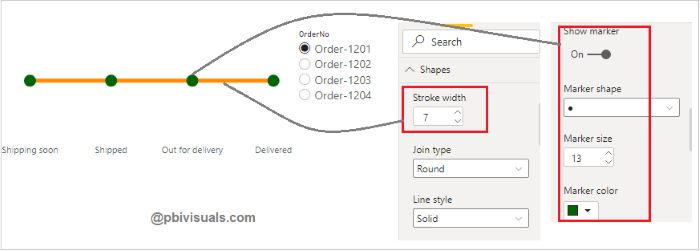
Title: Set the title name for chart.
Now create a measure for dynamic title change based on Order selection-
Title =
VAR SelectedOrder = SELECTEDVALUE(Orders[OrderNo])
Return
"Order Staus - #"& SelectedOrder
After that enable Title and click on function icon-

One dialogue box appears, now select Title measure and click on Ok button.

See the final result-

Refer more Power BI Post – Power BI
Hope you enjoyed the post. Your valuable feedback, question, or comments about this post are always welcome.
![]()