Data labels is one of the best way to display all label values on chart, also it allows you to customize the individual series labels display units.
Display units helps you to display label value units in some format like – None, Thousands, Millions, Billions or Trillions.
Let’s get started-
Download Sample dataset- Global_superstore_2016.xls
Follow these steps in order to enable data labels on chart:
Step-1: Import Orders dataset from Global superstore file.
After load data into Power BI file, check the datatype for order date column, if datatype is not in date format then change it as in date.
Step-2: Add clustered column chart visual into Power BI Report page from visualization pane.
Step-3: Select clustered column chart & add some columns into Fields section.
- Axis: ‘Year’ from Order date
- Legend: ‘Category’
- Value: ‘Sales’
Step-4: Enable data labels for clustered column chart-
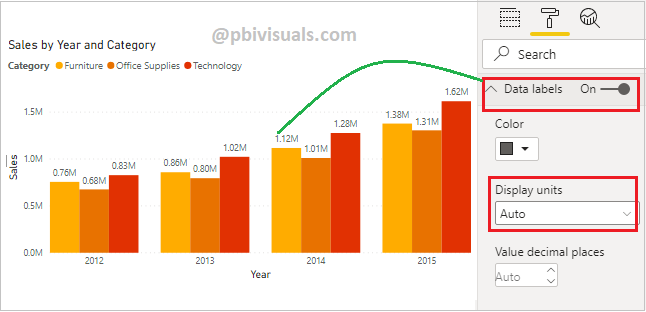
Select chart > go to format pane > turn on Data labels

Enable Data labels in Power BI
You can see in above screen shot data labels enable values for each category.
Data labels provides these options-
Color: You can change the Data labels color for values.
Display units: Provides you some pre defined format options for display units like – Auto, None, Thousands, Millions, Billions or Trillions and Default format is Auto.
Value decimal places: Set value for numbers of decimal places.
Orientation: Set labels display view like – Horizontal & vertical.
Position: Allows you to set the position of data labels units.
Text size: Set font size for data labels.
Font family: Set font family for data labels.
Show background: It enables background for data labels values.
Background color: You can change the background color.

Data labels options
Customize series: Allows you to customize the each category data labels color, display units, orientation, position & background color.
Select category from dropdown whose you want to change the format and set below highlighted properties-

Customize series for data labels
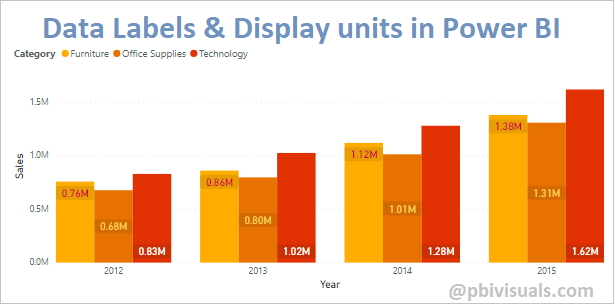
See the final format result-

Data labels and display units
Refer more Power BI Post – Power BI
Hope you enjoyed the post. Your valuable feedback, question, or comments about this post are always welcome.
