
In this blog you will understand “How to change the visual title Dynamically based on slicer selection values in Power BI?”
Let’s add two visuals into Power BI canvas as shown below screen shot.
1- Slicer Visual with Region fields.
2- Clustered column chart with Sales & region.

Following below steps to setup dynamic title change-
Step-1: Create a measure for dynamic title change on visual.
TitleTxt =
VAR GetValues= CONCATENATEX(
VALUES(Orders[Region]), Orders[Region], ", ")
RETURN
"Selected Region [ " & GetValues & " ]"
Measure Description:
- Var : Store the values
- Values : returns a one column table that contains the distinct values from the specified column.
- Concatenatex : Is useful to concatenate string.
Step-2: Select visual > go to format bar > turned on Title > click to fx icon.

Step-3: Title Text windows appears, now select the title measure.

Step-4: Now select values from region slicer & see the chart title dynamic change behavior.

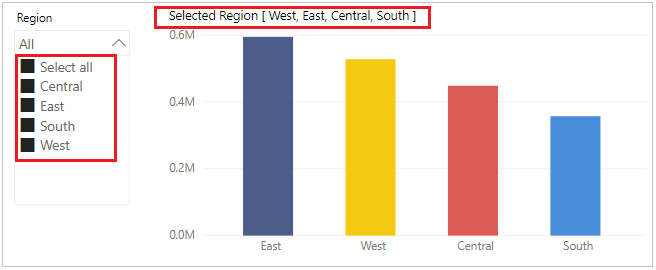
As you see, Title changing dynamically on selection of Region values.
Refer more Power BI Post – Power BI
Hope you enjoyed the post. Your valuable feedback, question, or comments about this post are always welcome.
![]()