Scroller custom visual helps you visualized data as an animating scrolling text. Also you can control the speed, size, status indications, coloring, etc.
You can scroll any custom message’s like- news headlines, report changes update notifications etc.
It scroll the data from right to left side, this visual is certified by Microsoft Power BI.
Let’s get started-
Load below sample dataset in your Power BI desktop file.
Table – Products
| Product | Sales | Profit_Loss |
| Bike | 120000 | 1500 |
| AC | 100000 | -2000 |
| Cycle | 20000 | -1000 |
| Fan | 10000 | 500 |
| Lights | 4000 | -200 |
| Bottle | 3000 | 1000 |
Follow these steps to create a Scroller Visual-
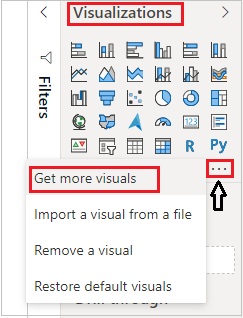
Step-1: To import visual from app source you have to Logged-In in Power BI desktop.
After that click on ellipsis icon under Visualization Pane > then click on Get more visuals.
Step-2: After that you will see the Power BI visual pop-up window. Now follow these steps-
Under AppSource Tab > Select Category “All” > Search for “Scroller” > Click on Add button.
Step-3: Now add visual into Power BI report Page and drag columns.
Category: Product
Measure Absolute: Sales
Measure Deviation: Profit_Loss

Formatting Scroller visuals-
You can set the font size, speed, status indications, color for scroller visuals, follow these properties.
General: Allows you to set X axis & Y axis, width & height of chart.
Title: Specified the Title name for Chart.
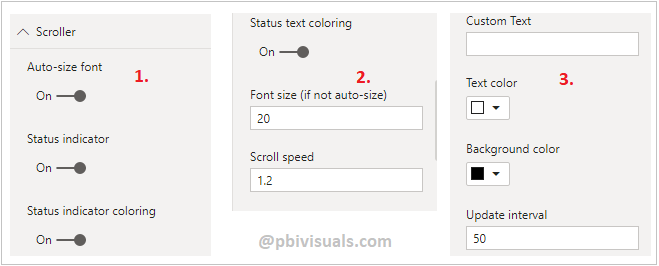
Scroller: Below properties comes under scroller-
- Auto-size font: This is default font size for text.
- Status indicator: It will enable/ disable status indicator for each category of data.
- Status indicator coloring: Based on positive or negative deviation value it will change the color of indicator.
- Font size (if not auto-size): You can set the manual font size for text, make sure your turned off Auto-size font property.
- Status text coloring: Change the color of text based on the positive or negative deviation value.
- Scroll speed: Allows you to control the speed of Scroller.
- Custom Text: Using this you can scroll the custom message(Hard code message).
- Text color: Change the custom message color, but you must turn off the Status text coloring property first.
- Background color: Change the background color as per your choice, default background color is black.
- Update interval: If you want to increase or decrease the frequency of time that the Scroller data is updated this use this feature.
See the final result-

Refer more Power BI visuals- Power BI Custom Visuals
Hope you enjoyed the post. Your valuable feedback, question, or comments about this post are always welcome.
![]()