
Calendar by Tallan is a Power BI custom visual, it provides a standard calendar layout that filters and aggregates data across a range of dates. This visual is certified by Microsoft Power BI.
Let’s get started-
Download Sample dataset- Global_superstore_2016.xls
Now follow these steps:
Step-1: Import Orders dataset from Global superstore file.
Step-2: To import visual from app source you have to Logged-In first in Power BI desktop.
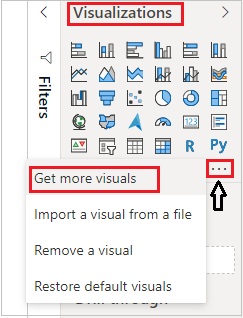
After that click on ellipsis icon under Visualization Pane > then click on Get more visuals.
Step-3: After that one dialogue appears and follow these steps-Under AppSource Tab > Select Category “All” > Search for “Tallan” > Click on Add button.

Step-4: Now add visuals into Power BI canvas with some columns-
Date: Order date column
Values: Sales

Step-5: Now click on any month name to see the particular month wise data

Step-6: Now you can see the individual month calendar sales date wise. If you want to back main calendar then click on Up arrow icon.

Formatting Calendar Tallan
General: Allows you to set X & Y axis, width & height for visual.
Calendar Configurations: Here you can set week start day.
Data color: Set data color for calendar.
Diverging colors: Using this you can apply the color based on the lowest, center and highest field values.
Title: Specified the Title name for visual.
Refer more Power BI visuals- Power BI Custom Visuals
Hope you enjoyed the post. Your valuable feedback, question, or comments about this post are always welcome.
![]()