Breadcrumbs are a great way to enhance the user experience in your Power BI reports. They provide clear navigation information or display selected values from slicers, helping users better understand the context of the data.
In this blog, I will guide you through the process of creating visually appealing breadcrumbs for your Power BI report.
Download the Dataset: Global Super Store Dataset – 2016
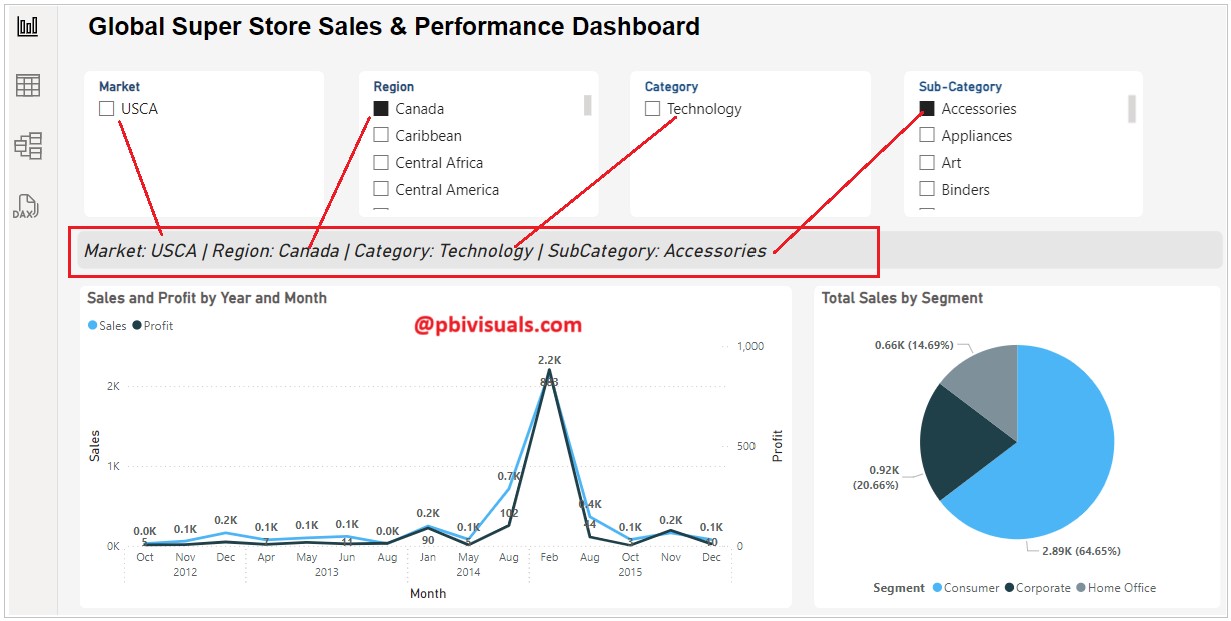
Breadcrumb Example:
Breadcrumb Measure:
Breadcrumbs =
VAR Market =
IF (
COUNT ( Orders[Market] ) <> 0,
IF (
ISFILTERED ( Orders[Market] ),
IF (
HASONEVALUE ( Orders[Market] ),
CONCATENATE ( "Market: ", MAX ( Orders[Market] ) ),
"Market: Multiple"
),
IF (
HASONEVALUE ( Orders[Market] ),
CONCATENATE ( "Market: ", MAX ( Orders[Market] ) ),
"Market: All "
)
),
"Market: None"
)

VAR Region =
IF (
COUNT ( Orders[Region] ) <> 0,
IF (
ISFILTERED ( Orders[Region] ),
IF (
HASONEVALUE ( Orders[Region] ),
CONCATENATE ( "Region: ", MAX ( Orders[Region] ) ),
"Region: Multiple"
),
IF (
HASONEVALUE ( Orders[Region] ),
CONCATENATE ( "Region: ", MAX ( Orders[Region] ) ),
"Region: All"
)
),
"Region: None"
)

VAR Category =
IF (
COUNT ( Orders[Category] ) <> 0,
IF (
ISFILTERED ( Orders[Category] ),
IF (
HASONEVALUE ( Orders[Category] ),
CONCATENATE ( "Category: ", MAX ( Orders[Category] ) ),
"Category: Multiple"
),
IF (
HASONEVALUE ( Orders[Category] ),
CONCATENATE ( "Category: ", MAX ( Orders[Category] ) ),
"Category: All"
)
),
"Category: None"
)
VAR SubCategory =
IF (
COUNT ( Orders[Sub-Category] ) <> 0,
IF (
ISFILTERED ( Orders[Sub-Category] ),
IF (
HASONEVALUE ( Orders[Sub-Category] ),
CONCATENATE ( "SubCategory: ", MAX ( Orders[Sub-Category] ) ),
"SubCategory: Multiple"
),
IF (
HASONEVALUE ( Orders[Sub-Category] ),
CONCATENATE ( "SubCategory: ", MAX ( Orders[Sub-Category] ) ),
"SubCategory: All"
)
),
"SubCategory: None"
)
RETURN
Market & " | " & Region & " | " & Category & " | " & SubCategory
Follow the steps below to create breadcrumbs:
Step-1: Add a measure to the report, use the code provided above, and modify it according to your dataset columns and slicers.
Right-click on the dataset name > select “New Measure.”
Step-2: Add a text box to the report page by navigating to the Insert tab and selecting Text Box.
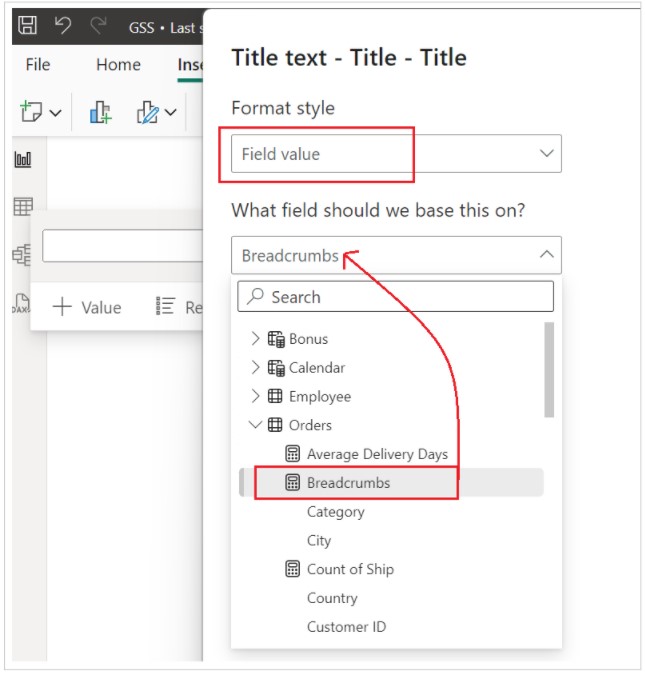
Step-3: Select the text box, enable the Title option, and click on the Fx icon.

Step-4: After that, select Field Value from the Format Style dropdown and choose the Breadcrumbs measure. And click on OK button.
Step-5: Now, test the breadcrumbs by changing the values of the slicers.
Watch the video to understand a detailed explanation of the measure code and breadcrumbs:
I hope you enjoyed this post.
![]()