Power Pivot, Power Query and Power View in Power BI
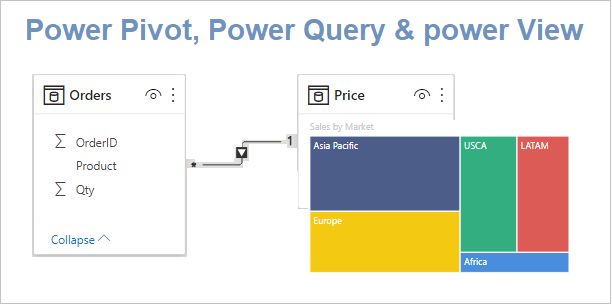
What is Power Query, Power Pivot & Power View in Power BI Desktop?
![]()
What is Power Query, Power Pivot & Power View in Power BI Desktop?
![]()
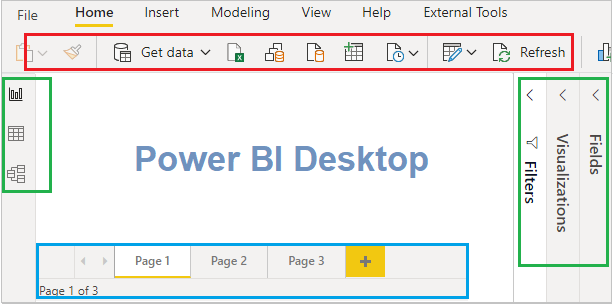
Understand Power BI Desktop main areas – Ribbon, Pages tab, Visualization, Views & Fields pane.
![]()

Comicgen custom visual in Power BI, Adds comic characters whose emotion, pose, angle, etc can be controlled by data.
![]()

How you can display orders shipment tracking status on Power BI visual like others e-commerce site?
![]()

Cylindrical Gauge by MAQ Software, Power BI custom visual – Microsoft AppSource.
![]()

Creating a Hierarchy Chart visual in Power BI, custom visual – Hierarchy Chart by Akvelon in Power BI.
![]()

Display hierarchical data in Tree structure form using TreeViz custom visual in Power BI.
![]()
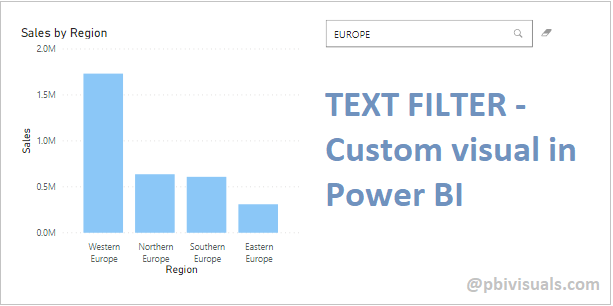
Text Filter custom visual in Power BI, how to filter visuals by typing in a value into the search box?
![]()
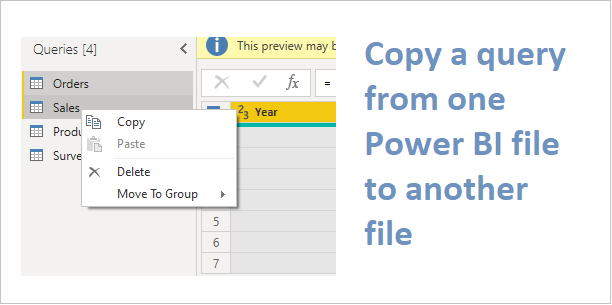
How to copy Queries from one Power BI report to another? Copy dataset from one file to another in Power BI.
![]()
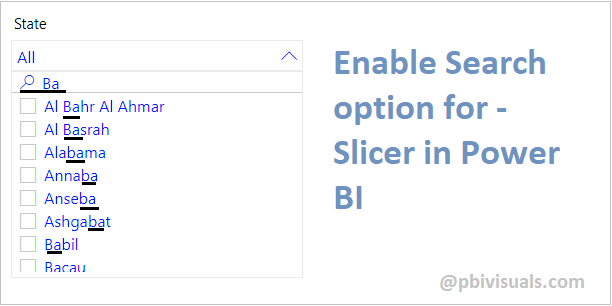
How to add a Search Box to a Slicer in Power BI? Search option in Power BI slicer.
![]()

How to display data labels on chart in Power BI and what is display units?
![]()

Hierarchical axis and concatenate labels on chart Power BI.
![]()

Tornado chart custom visual in Power BI, compare two categories data values in Power BI.
![]()
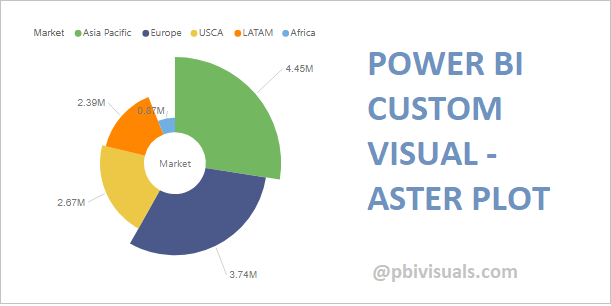
How to create a Aster Plot in Power BI? Aster Plot custom visual in Power BI.
![]()

How to create a Multi KPIs in Power BI? Key Performance Indicator in Power BI.
![]()