
In this blog you will understand “How to create a Hierarchy in Power BI?”.
Power BI Desktop allows you to create your own Hierarchies, it provides drill down action to the Power BI report.
When a visual has a hierarchy, it enables the ability to drill down for additional relevant details.
For example – you might have a visualization that shows the Region hierarchy with Sales and you want to drill down on a specific product category that is under-performing.
Let’s get started-
Download the sample Dataset from below link-
Following these steps in order to create a Hierarchy-
Step-1: Import Orders dataset from Global superstore file.
Step-2: Hierarchy sequence – Region > Category > Sub-category
Step-3: Right click on Region > Select New Hierarchy

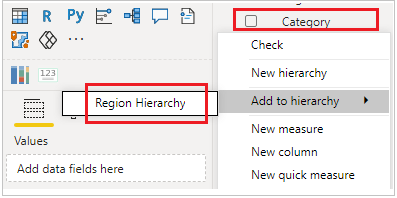
Step-4: After that right click on Category > Add to Hierarchy > Region Hierarchy
Step-4: Now right click on Sub-category > Add to Hierarchy > Region Hierarchy, now you can see the final Hierarchy-

Step-5: Add Pie chart visual into Power BI canvas with Region Hierarchy & Sales column.
Legend: Add Region Hierarchy
Values: Sales

Enable Drill down and drill up in a Pie chart-
Step-1: Mouseover the Pie chart, four icons appears like below screenshot.

First icon: It is used to drill up the data one step back.
Second icon: It is used to enable drill down mode.
Third icon: Display next level Hierarchy.
Fourth icon: It is used to expend all Hierarchy.
Step-2: To Enable Drill down mode, click to second icon( Drill down icon).

Step-3: Now click on Pie chart any point, it will drill down to you next level of hierarchy and display to you Categories under selected Region.

Step-4: Now click on any category, it will drill down to you sub-category under selected category.

Step-5: Now using Drill up icon you can go back step by step till first level.

In same way you can use Next level hierarchy(icon 3) & Expand all hierarchy(icon 4).
Next level hierarchy(icon 3): In first click it will display you category data, and in second click it will display sub-category data.
Expand all hierarchy(icon 4): In first click it will display region & category data together, and in second click it will display region, category & sub-category data together.
Refer more Power BI Post – Power BI
Hope you enjoyed the post. Your valuable feedback, question, or comments about this post are always welcome.
![]()